
Top Languages by GDP
Into which languages should your company translate first? There are many ways to determine the answer, not all of which are mentioned in this tip. An e-commerce business may wish to first prioritize the top 10 internet languages. Other international companies less dependent on the internet for customer transactions may wish to look at the top languages and locales by Gross Domestic Product (GDP).
This tip includes the following charts and tables:
- Top Languages by Percentage of GWP (Chart & Table)
- Top Countries by Percentage of GWP (Chart, Map, & Table)
The top 15 languages can grant access to countries that make up more than 90% of the Gross World Product (GWP).
Chart: Top Languages by Percentage of GWP
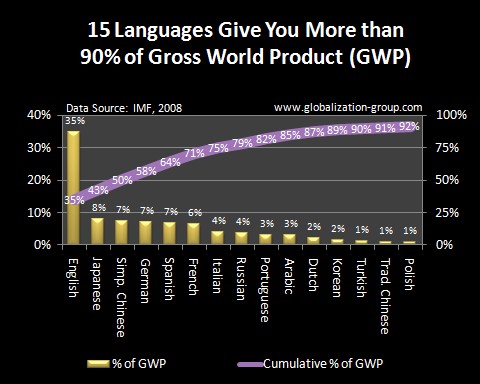
Table: Top Languages by Percentage of GWP
| Rank | Language | GDP(in $US Billions) | % of GWP | Cumulative% of GWP |
|---|---|---|---|---|
| 1 | English | $ 21,276 | 34.9% | 34.9% |
| 2 | Japanese | $ 4,911 | 8.1% | 43.0% |
| 3 | Simplified Chinese | $ 4,509 | 7.4% | 50.4% |
| 4 | German | $ 4,393 | 7.2% | 57.6% |
| 5 | Spanish | $ 4,170 | 6.8% | 64.5% |
| 6 | French | $ 3,951 | 6.5% | 71.0% |
| 7 | Italian | $ 2,481 | 4.1% | 75.0% |
| 8 | Russian | $ 2,245 | 3.7% | 78.7% |
| 9 | Portuguese | $ 1,915 | 3.1% | 81.9% |
| 10 | Arabic | $ 1,903 | 3.1% | 85.0% |
| 11 | Dutch | $ 1,386 | 2.3% | 87.3% |
| 12 | Korean | $ 929 | 1.5% | 88.8% |
| 13 | Turkish | $ 730 | 1.2% | 90.0% |
| 14 | Traditional Chinese | $ 607 | 1.0% | 91.0% |
| 15 | Polish | $ 528 | 0.9% | 91.8% |
The calculations above are a little rough due to the fact that some countries speak multiple languages and GDP is not broken down precisely by each language. However, the potential room for error does not affect the ranking significantly.
Of course, the GDP totals for many of these languages include various locales, some of which are regularly treated as separate language translations. For example, Canadian French is different enough from European French that the Canadian market regularly requires a distinct translation. The same applies to the difference between Mexican Spanish and European Spanish, the difference between Brazilian Portuguese and European Portuguese, and the difference between US English and UK English. In addition to such linguistic differences, there are also other regional and cultural differences that cause us to want to break up each language into one or more separate locales for purposes of localization.
The top 26 countries make up 85% of Gross World Product, as illustrated in the chart, map, and table below.
 © 2025 COPYRIGHT GLOBALIZATION GROUP